
2.3.3What does it look like really close?
Local Linearity
Investigate the local behavior of
What does the graph look like? Sketch the graph before and after you zoom in.
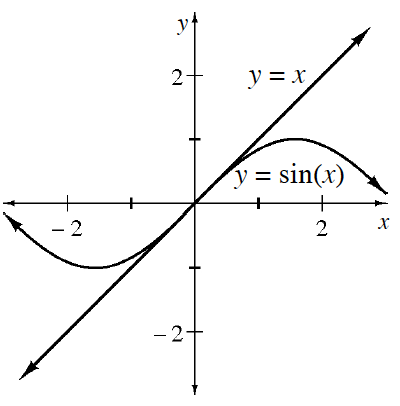
Since the graph of
resembles a line in a small “local” region, we say the function is locally linear. Is truly linear close to ? Why or why not?
Study the list of basic functions below. Although the graphs vary widely by shape, some look exactly the same when you zoom in very close. What does each function look like when you zoom in at
You probably noticed that
does not have a local linearization at because at it has a cusp. What do you think the term “cusp” means and why do you think a function cannot be linearized at a cusp?
Examine the linearization of
Complete the table below for various
-values. For what values of
is the line a good approximation of ? Write a statement summarizing your findings. On what domain is
an overestimate? On what domain is it an underestimate? You should be able to see this information on both the graph and the table. Estimate
. Now estimate
.

Essential Limits of Trigonometric Functions
In the diagram at right,
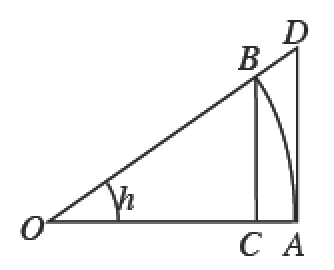
Proof 1:
Since
Proof 2:
Hence,
By (1), the first limit is
Local Linearity
When the graph of a function,
While zooming in on a particular point of a function, often the curvature of the function becomes less noticeable as seen in the example at right.
.png)
Determine if the following functions are even, odd, or neither. Explain how you determined your choice. Homework Help ✎
The rate of customers who pass through the checkout stand at a grocery store depends on the time of day. Assume the rate follows the following piecewise-defined function, where
Graph the function and state its domain and range.
Is this function continuous?
Calculate the area under the curve for
. What are the units of this area? What does this area represent?
Fertilizer needs to be applied during the fastest growth of the plant. At right is the graph of the growth cycle of a flowering shrub. Homework Help ✎
Using complete sentences, write a detailed statement describing the growth of this shrub for
months. During what time interval should the plant be fertilized?
Approximately how fast is the shrub growing at
? How did you get your answer? What is the shrub's average rate of growth over the complete growth cycle? How did you get your answer?
.png)
Rotate the flag shown at right (created by the region under the curve for
.png)
What is the relationship between the slopes of perpendicular lines? If you know the slope of one of the lines, how can you determine the slope of the perpendicular line? Homework Help ✎
A function,


